LOGO
PL

Signs and lines in lung ultrasound

Rohit Bhoil1, Ajay Ahluwalia1, Rajesh Chopra2, Mukesh Surya1, Sabina Bhoil3

Affiliation and address for correspondence
J Ultrason 2021; 21: e225–e233
DOI: 10.15557/JoU.2021.0036
PlumX metrics:
Abstract

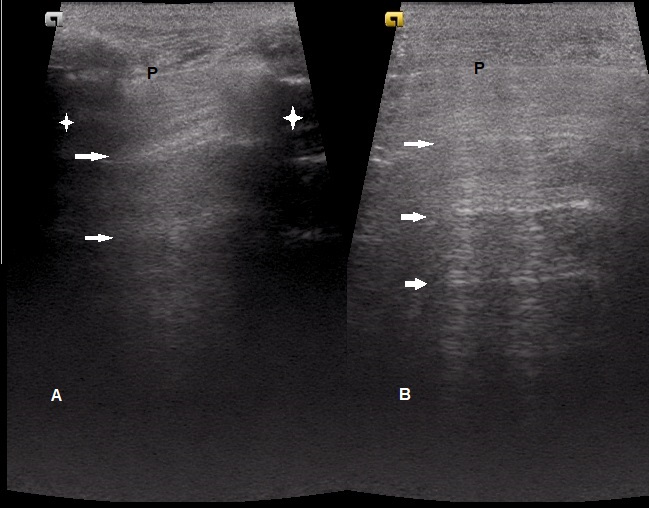
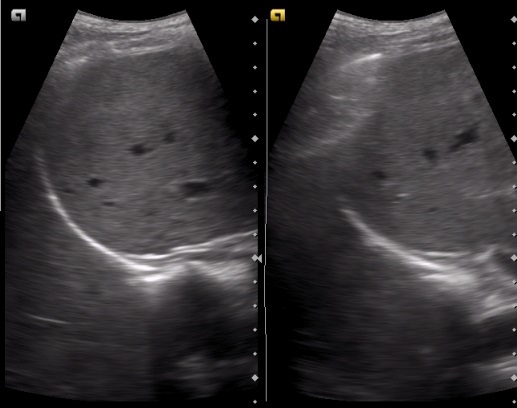
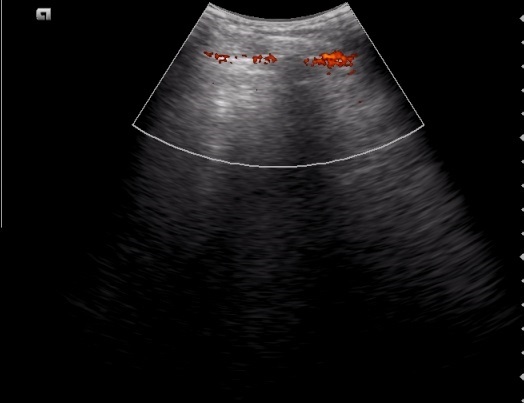
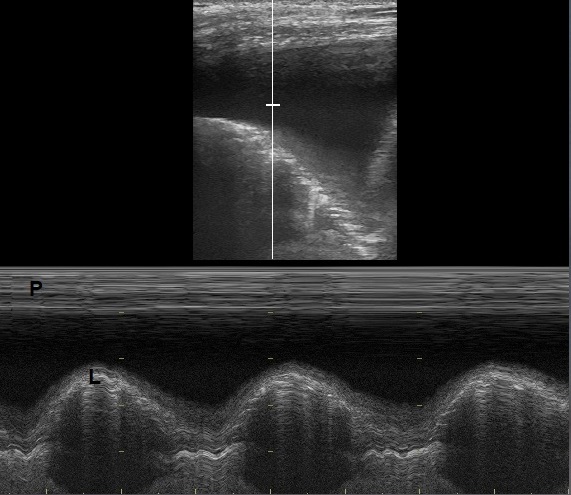
Point-of-care ultrasound has become firmly established in acute and critical care settings, and is now increasingly being used as an important tool in the assessment of the lungs. In this article, we briefly describe the technique of lung ultrasound and the various lines and signs commonly encountered during sonography of the lung, namely the normally visualised A- and T-lines and the bat sign, sliding sign (power slide sign on colour Doppler), sea-shore sign, curtain sign, and the lung pulse. We have also described signs seen in various pathological conditions like B-lines seen in cases of increased lung density; the quad sign, sinusoid sign, thoracic spine sign, plankton sign and the jelly fish sign seen in pleural effusion; the stratosphere sign and the lung point sign seen in pneumothorax; the shred/fractal sign and tissue-like sign in consolidation, and the double lung point sign seen in transient tachypnoea of the newborn. With adequate and appropriate training, lung ultrasound can be effectively utilised as a pointof- care investigation.

Keywords
sonography, emergency ultrasound, POCUS, BLUE protocol
Fig. S1. A. Grey scale ultrasound image using a high-frequency linear transducer (7–12 MHz) showing the longitudinal scan of the intercostal space depicting the bat sign. B. Probe placed in oblique orientation; in this view the ribs are not visualised and only the pleural line is seen. P – pleural line; arrows indicate A-lines, and stars point to rib shadows
Fig. S2. Grey scale ultrasound image depicting the curtain sign – the aerated lung in the costophrenic recess overlaps part of the liver and diaphragm, creating a demarcated leading edge of the lung air artefact, giving the appearance of a curtain (of air). Both images are in different part of the respiratory cycle
Fig. S3. Power Doppler image of normal sliding lung. The presence of colour indicates movement at the pleural line
Fig. S4. Grey scale M-mode ultrasound image of pleural effusion depicting the sinusoid sign, obtained with a linear transducer
Video 1A. Ultrasound clips showing the normal curtain sign
Video 1B. Ultrasound clips showing absence of normal curtain sign in pleural effusion
Video 2A. Ultrasound clips showing the sliding sign i.e. movement at the pleural line with a low-frequency curvilinear transducer (3–6 MHz)
Video 2B. Ultrasound clips showing the sliding sign i.e. movement at the pleural line with a high-frequency linear transducer (7–12 MHz)
Video 3. M-mode ultrasound clip depicting the sea-shore sign
Video 5. Ultrasound clip showing the floating membranes/septae in a case of ruptured hydatid of the lung into the pleural cavity
Video 4A. Ultrasound clips showing collapsed lung in dynamic motion appearing as moving jellyfish on real-time sonography. Bilateral pleural effusion
Video 4B. Ultrasound clips showing collapsed lung in dynamic motion appearing as moving jellyfish on real-time sonography. Unilateral pleural effusion